Reporting made easy
Having a load of data is useless without the proper tools to analyze it. With our report tools you can filter down your data through conditional filters that lets you extract the exact data you need. Combined with time ranges, you can control what data and when the respondent submitted their answers, down to the minute.
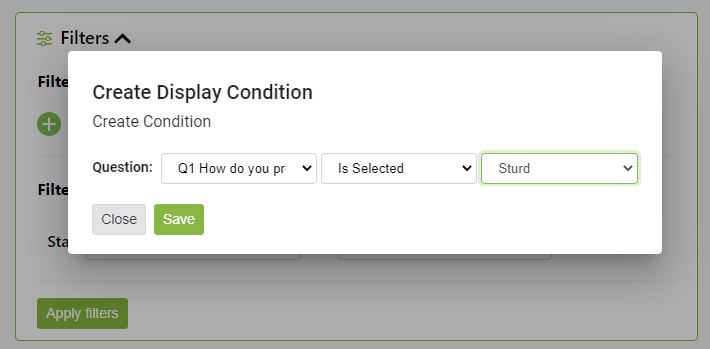
Conditional filters give you the power of specific data
Conditional filters are perfect when you need a specific portion of your raw data, for example who among the respondents likes vegetarian food and what do that specific segment of respondents feel about certain restaurants the specialize in vegetarian food? Simply choose a question and what kind of filter you need and watch the data processor turn your raw data in to useful facts about your customers habits or opinions of your product.
You can combine several conditional filters to create even more specific data points by simply adding another filter.
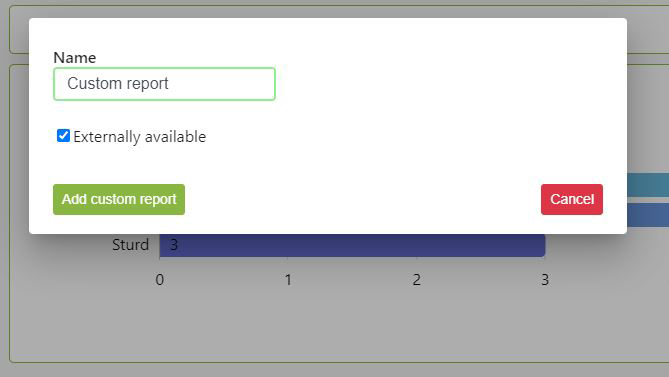
Create Custom reports in an instance
Sometimes you only need a couple of graphs in a report to make a point. With our Save-Custom-Report feature you will be able hide graphs that aren’t needed. If your survey contains a lot of conditional questions (read more about question logic here), the reports tool lets you create infinite numbers of custom reports so that you easily can present different point of views of your raw data, without scrolling through an ocean of conditional questions.
Share your reports
Don’t want to share your credentials to let others gain access to your reports? No problem, you can easily make shareable reports and send it to anyone with a click of a button! The sharable report consists of a public URL that you can post on your intranet or among your customers/members if you want them to take part of the survey result.
Looking for our SMS Services?